JBDON
  • Home
  • Applied Analytics
    • Analytics for Decision Making >
      • What is Cluster Analysis
      • Data Reduction and Unsupervised Learning
      • Preparing Data and Measuring Dissimilarities
      • Hierarchical and k-Means Clustering
      • Defining Output Variables and Analyzing the Results
      • Using Historical Data to Model Uncertainty
      • Models with Correlated Uncertain Variables
      • Creating and Interpreting Charts
      • Using Average Values versus Simulation
      • Optimization and Decision Making
      • Formulating an Optimization Problem
      • Developing a Spreadsheet Model
      • Adding Optimization to a Spreadsheet Model
      • What-if Analysis and the Sensitivity Report
      • Evaluating Scenarios and Visualizing Results to Gain Practical Insights
      • Digital Marketing Application of Optimization
      • Advanced Models for Better Decisions
      • Business Problems with Yes/No Decisions
      • Formulation and Solution of Binary Optimization Problems
      • Metaheuristic Optimization
      • Chance Constraints and Value At Risk
      • Simulation Optimization
    • Analytics for Marketing >
      • Marketing Analytics and Customer Satisfaction
      • Customer Satisfaction
      • Measurements and Scaling Techniques – Introduction
      • Primary Scales of Measurement
      • Comparative Scaling
      • Non-Comparative Scaling
      • Experiment Design: Controlling for Experimental Errors
      • A/B Testing: Introduction
      • A/B Testing: Types of Tests
      • ANOVA – Introduction
      • Example -Inspect Spray and Tooth Growth
      • Logit Model - Binary Outome and Forecastign linear regression
      • Text Summarization
      • Social media Microscope
      • N-Gram - Frequcy Count and phase mining
      • LDA Topic Modeling
      • Machine-Learned Classification and Semantic Topic Tagging
    • Data Engine >
      • Understanding The Growth Of Data
      • Evaluating Methods Of Data Access
      • Communication journey
      • Data Journey
      • Planning for data visualisation
      • Visualisation Component
      • Content Connection and Chart Legitibility
    • Customer Insights >
      • Introduction
      • What is Descriptive Analytics?
      • Survey Overview
      • Net Promoter Score and Self-Reports
      • Survey Design
      • Passive Data Collection
      • Media Planning
      • Data Visualization
      • Causal Data Collection and Summary
      • Asking Predictive Questions
      • Regression Analysis
      • Data Set Predictions
      • Probability Models
      • Results and Predictions
      • Perspective Analytics (Maximize Revenue and Market Structure Competitions)
    • Analytics for Advance Marketing >
      • Visualisation and statistics (Political Advertising,Movie Theater and Data Assembly)
      • Excel Analysis of Motion Picture Industry Data
      • Displaying Conditional Distributions
      • Analyzing Qualitative Variables
      • Steps in Constructing Histograms
      • Common Descriptive Statistics for Quantitative Data
      • Regression-Based Modeling
      • Customer Analytics
      • Illustrating Customer Analytics in Excel
      • Customer Valuation Excel Demonstration
  • Soft Skills
    • Adaptability
    • Confidence
    • Change Management
    • Unlearning and Learning
    • Collaboration and Teamwork
    • Cultural Sensitivity
  • Marketing
  • Finance
  • Economics
    • Introduction to Managerial Economics >
      • Basic Techniques
      • The firm: Stakeholders, Objectives and Decision Issues
      • Demand and Revenue Analysis >
        • Demand Estimation and Forecasting
        • Demand Elasticity
        • Demand Concepts and Analysis >
          • Formulation and Solution of Binary Optimization Problems
      • Scope of Managerial Economics
    • Prodution and Cost Analysis >
      • Production Function
      • Estimation of Production and Cost Functions
      • Cost Concepts and Analysis I
      • Cost Concepts and Analysis II
    • Pricing Decisions >
      • Pricing strategies >
        • Adding Optimization to a Spreadsheet Model
      • Market structure and microbes barriers to entry
      • Pricing under pure competition and pure monopoly
      • Pricing under monopolistic and oligopolistic competition
    • Narendra Modi Development Model of Gujarat
  • JBDON Golf
    • Digital Marketing Application of Optimization
  • Let's Talk
  • MBA Project Sharing
  • About Us
    • Good Read >
      • IIMC says PepsiCo CEO Indra Nooyi was an average student
      • India’s middle class figures in Fortune’s Top Ten list of those who matter
      • The Start-Up of you.
      • BUYING AND MERCHANDISING
      • HUMAN RESOURCE MANAGEMENT
      • Do You Suffer From Decision Fatigue?
      • New Page
      • About social media and web 2.0
      • Building Your Own Start-up Technology Company, Part 1
      • Building Your Own Start-up Technology Company, Part 2
      • Building Your Own Start-up Technology Company, Part 3
      • Building Your Own Start-up Technology Company, Part 4
      • Renewable energy is no longer alternative energy
      • What Makes an Exceptional Social Media Manager?
      • The Forgotten Book that Helped Shape the Modern Economy
      • Home
      • How to Think Creatively
      • A Lighthearted Looks at Project Management and Sports Analogies
      • Why Trust Matters More Than Ever for Brands
  • CET Knowledge Zone
    • Tips From JBIMS Students >
      • Prasad Sawant
      • Chandan Roy
      • Ram
      • Ashmant Tiwari
      • Rajesh Rikame
      • Ami Kothari
      • Ankeet Adani
      • Sonam Jain
      • Marketing Analytics and Customer Satisfaction
      • Mitesh Thakker
      • Tresa Sankoorikal
    • Speed Techniques
    • CET Workshops
  • Untitled
  • New Page
    • Cluster analysis using excel and excel miner
    • Chance Constraints and Value At Risk
    • Adding Uncertainty to a Spreadsheet Model
  • Adidas

Data Interpretation (25 Marks)

2/6/2011

2 Comments

 
Picture
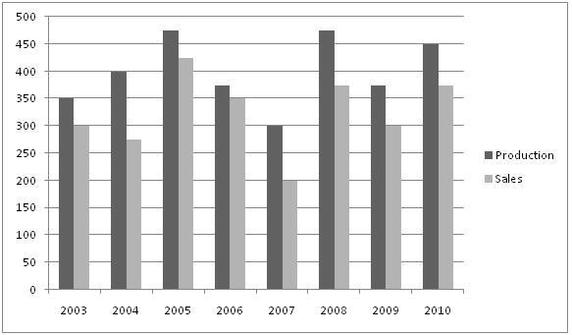
Directions: Above graph shows the annual production and sales (in units) of ‘Dove’ soap from 2003 to 2010.
1. What is the average production of the soap from 2003 to 2010?
(a) 375    (b)  387.5  (c) 400 (d) 425 (e) None of these

2. What is the total sales for the entire given period?

(a) 2400    (b)  2600  (c) 2800 (d) 2450 (e) None of these

3. What is the difference between the total sales and total production for the entire period?

(a) 600    (b)  625  (c) 575 (d) 650 (e) None of these

 4. Which year showed the maximum percentage increase in sales?

(a) 2005    (b)  2008  (c) 2009 (d) 2010 (e) None of these

 5. Which year showed the minimum percentage increase in the production?

(a) 2004    (b) 2005  (c) 2008 (d) 2010 (e) None of these


  Following graph shows number of boys and girls from different schools in participated in inter school sports competition.


Abhinav

Prabodhini

Vidyabhavan

Garware

Modern


Boys

Girls

Boys

Girls

Boys

Girls

Boys

Girls

Boys

Girls

2006

120

90

80

60

150

120

180

160

145

125

2007

140

150

85

50

130

140

200

180

155

130

2008

110

95

100

75

140

145

205

175

150

110

2009

95

100

95

55

145

125

190

165

140

140

2010

120

80

90

50

135

130

180

160

170

145


6. What is the average number of boys participated from Modern for the entire period?

(a) 150 (b) 148 (c) 152 (d) 154 (e) None of these

7. What is the difference between number of boys and number of girls participated from Abhinav for the entire period?

(a) 50 (b) 65 (c) 70 (d) 75 (e) None of these

8. Which year showed the highest number of participants?

(a) 2006 (b) 2007 (c) 2008 (d) 2009 (e) 2010

9. The approximate percentage increase in the number of participants in 2010 compared to 2009 was:

(a) 0.8 (b) 2.4 (c) 3.2 (d) 0.4 (e) 5

10. What is the difference between the number of girls participated from Vidyabhavan and Garware for the entire period?

(a) 150 (b) 180 (c) 185 (d) 175 (e) None of these

Picture
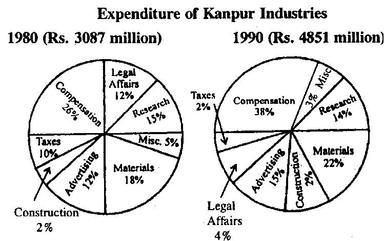
Directions: Above pie charts show the expenditure of Kanpur Industries in two different years 1980 and 1990. Study the pie charts and answer these questions.
11. The amount spent on materials for 1980 was 120% of the amount spent on :

(a) Research in 1980       (b) Advertising in 1980 

(c) Compensation in 1980 (d) Legal affairs in 1980


12. The fraction of the total expenditures for 1980 and 1990 spent on compensation is nearest to

(a) ½  (b) 1/3             (c) ¼    (d) 1/5

13. The amount spent on taxes in 1980 was nearest to the amount spent on

(a) Research in 1990             

(b) Misc in 1990

(c) Legal affairs and taxes in 1990

(d) Construction and Misc in 1990

14. Expenditure on Misc, Legal Affairs and Research in 1990 was nearest to the expenditure on

(a) Compensation and taxes in 1980

(b) Compensation and advertising in 1980

(c) Advertising and material in 1980

(d) Research and materials in 1980

15. What is the ratio between the expenditure on Legal affairs in 1980 to that in 1990

(a) 13:9     (b) 15:8  (c) 12:11   (d) 9:7
 

Picture
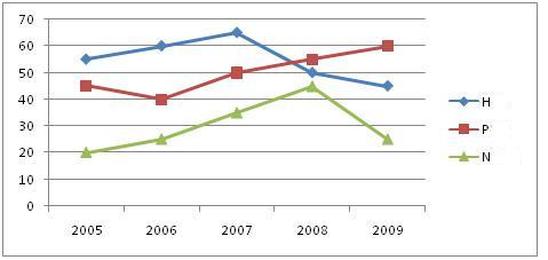
The graph shows the annual sales (in Rs. Cr.) of three major companies : H, P and N. Understand the graph and answer the questions that follow.
16.  What is the average sale of 'P' for all the years?

            (a) 50   (b) 40   (c) 45   (d) 55

17.  What is the difference between the sales of 'H' and 'P' for all the years?

             (a) 30  (b) 20   (c) 25   (d) 35

18.  Which company and in which year has shown the maximum percentage increase in the sales in a year compared to the previous year?

(a) H in 2006            (b) P in 2007            (c) N in 2007        (d) N in 2008

19.  What is the total sales of all the companies from 2005 to 2007?

(a) 395             (b) 385             (c) 390             (d) 400

20.  What is the ratio of sales of N to that of H considering all the years?

(a) 3:7              (b) 5:11           (c) 6:11            (d) 3:5

Picture
We mentor, motivate and guide students# To increase their scores by teaching our unique speed techniques and strategies# To get edge over others by mastering the art of GD & PI# To enable them to make the right career decisions
2 Comments

    RSS Feed

Powered by Create your own unique website with customizable templates.
  • Home
  • Applied Analytics
    • Analytics for Decision Making >
      • What is Cluster Analysis
      • Data Reduction and Unsupervised Learning
      • Preparing Data and Measuring Dissimilarities
      • Hierarchical and k-Means Clustering
      • Defining Output Variables and Analyzing the Results
      • Using Historical Data to Model Uncertainty
      • Models with Correlated Uncertain Variables
      • Creating and Interpreting Charts
      • Using Average Values versus Simulation
      • Optimization and Decision Making
      • Formulating an Optimization Problem
      • Developing a Spreadsheet Model
      • Adding Optimization to a Spreadsheet Model
      • What-if Analysis and the Sensitivity Report
      • Evaluating Scenarios and Visualizing Results to Gain Practical Insights
      • Digital Marketing Application of Optimization
      • Advanced Models for Better Decisions
      • Business Problems with Yes/No Decisions
      • Formulation and Solution of Binary Optimization Problems
      • Metaheuristic Optimization
      • Chance Constraints and Value At Risk
      • Simulation Optimization
    • Analytics for Marketing >
      • Marketing Analytics and Customer Satisfaction
      • Customer Satisfaction
      • Measurements and Scaling Techniques – Introduction
      • Primary Scales of Measurement
      • Comparative Scaling
      • Non-Comparative Scaling
      • Experiment Design: Controlling for Experimental Errors
      • A/B Testing: Introduction
      • A/B Testing: Types of Tests
      • ANOVA – Introduction
      • Example -Inspect Spray and Tooth Growth
      • Logit Model - Binary Outome and Forecastign linear regression
      • Text Summarization
      • Social media Microscope
      • N-Gram - Frequcy Count and phase mining
      • LDA Topic Modeling
      • Machine-Learned Classification and Semantic Topic Tagging
    • Data Engine >
      • Understanding The Growth Of Data
      • Evaluating Methods Of Data Access
      • Communication journey
      • Data Journey
      • Planning for data visualisation
      • Visualisation Component
      • Content Connection and Chart Legitibility
    • Customer Insights >
      • Introduction
      • What is Descriptive Analytics?
      • Survey Overview
      • Net Promoter Score and Self-Reports
      • Survey Design
      • Passive Data Collection
      • Media Planning
      • Data Visualization
      • Causal Data Collection and Summary
      • Asking Predictive Questions
      • Regression Analysis
      • Data Set Predictions
      • Probability Models
      • Results and Predictions
      • Perspective Analytics (Maximize Revenue and Market Structure Competitions)
    • Analytics for Advance Marketing >
      • Visualisation and statistics (Political Advertising,Movie Theater and Data Assembly)
      • Excel Analysis of Motion Picture Industry Data
      • Displaying Conditional Distributions
      • Analyzing Qualitative Variables
      • Steps in Constructing Histograms
      • Common Descriptive Statistics for Quantitative Data
      • Regression-Based Modeling
      • Customer Analytics
      • Illustrating Customer Analytics in Excel
      • Customer Valuation Excel Demonstration
  • Soft Skills
    • Adaptability
    • Confidence
    • Change Management
    • Unlearning and Learning
    • Collaboration and Teamwork
    • Cultural Sensitivity
  • Marketing
  • Finance
  • Economics
    • Introduction to Managerial Economics >
      • Basic Techniques
      • The firm: Stakeholders, Objectives and Decision Issues
      • Demand and Revenue Analysis >
        • Demand Estimation and Forecasting
        • Demand Elasticity
        • Demand Concepts and Analysis >
          • Formulation and Solution of Binary Optimization Problems
      • Scope of Managerial Economics
    • Prodution and Cost Analysis >
      • Production Function
      • Estimation of Production and Cost Functions
      • Cost Concepts and Analysis I
      • Cost Concepts and Analysis II
    • Pricing Decisions >
      • Pricing strategies >
        • Adding Optimization to a Spreadsheet Model
      • Market structure and microbes barriers to entry
      • Pricing under pure competition and pure monopoly
      • Pricing under monopolistic and oligopolistic competition
    • Narendra Modi Development Model of Gujarat
  • JBDON Golf
    • Digital Marketing Application of Optimization
  • Let's Talk
  • MBA Project Sharing
  • About Us
    • Good Read >
      • IIMC says PepsiCo CEO Indra Nooyi was an average student
      • India’s middle class figures in Fortune’s Top Ten list of those who matter
      • The Start-Up of you.
      • BUYING AND MERCHANDISING
      • HUMAN RESOURCE MANAGEMENT
      • Do You Suffer From Decision Fatigue?
      • New Page
      • About social media and web 2.0
      • Building Your Own Start-up Technology Company, Part 1
      • Building Your Own Start-up Technology Company, Part 2
      • Building Your Own Start-up Technology Company, Part 3
      • Building Your Own Start-up Technology Company, Part 4
      • Renewable energy is no longer alternative energy
      • What Makes an Exceptional Social Media Manager?
      • The Forgotten Book that Helped Shape the Modern Economy
      • Home
      • How to Think Creatively
      • A Lighthearted Looks at Project Management and Sports Analogies
      • Why Trust Matters More Than Ever for Brands
  • CET Knowledge Zone
    • Tips From JBIMS Students >
      • Prasad Sawant
      • Chandan Roy
      • Ram
      • Ashmant Tiwari
      • Rajesh Rikame
      • Ami Kothari
      • Ankeet Adani
      • Sonam Jain
      • Marketing Analytics and Customer Satisfaction
      • Mitesh Thakker
      • Tresa Sankoorikal
    • Speed Techniques
    • CET Workshops
  • Untitled
  • New Page
    • Cluster analysis using excel and excel miner
    • Chance Constraints and Value At Risk
    • Adding Uncertainty to a Spreadsheet Model
  • Adidas