Best- And Worst-Performing Cloud Computing Stocks April 21st To April 25th And Year-to-Date4/28/2014 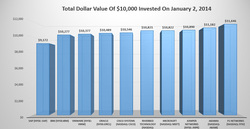
The six highest performing cloud computing stocks year-to-date in the Cloud Computing Index are F5 Networks (NASDAQ: FFIV), Akamai (NASDAQ: AKAM), Juniper Networks (NYSE:JNPR), Riverbed Technologies (NASDAQ:RVBD), VMWare (NYSE:VMW) AND Cisco Systems (NASDAQ: CSCO). A $10K investment in F5 Networks shares made on January 2nd of this year is worth $11,646 as of market close on Friday.
Akamai Update Akamai (NASDAQ:AKAM) operates the world’s largest on-demand distributing computing platform, with more than 140,000 servers and approximately 1,200 networks operating worldwide today. In the coming quarters Akamai has said they will continue to invest aggressively in new technologies, specifically those that can further their market leadership in global content delivery, cloud optimization, Internet security and mobile integration. With 20%+ increases in R&D spending this year planned, Akamai intents to out-innovate its competitors in existing and new markets. IBM, Microsoft, Oracle and SAP share prices and YTD values of a $10K investment made on January 2nd of this year are also shown. 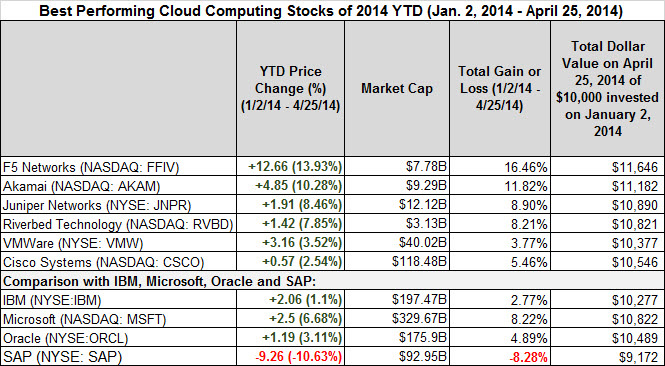
Who’s Delivering The Best Returns
The following graphic compares how $10,000 invested on January 2nd of this year in the highest performing cloud computing stocks, in addition to IBM, Microsoft, Oracle and SAP are valued today. 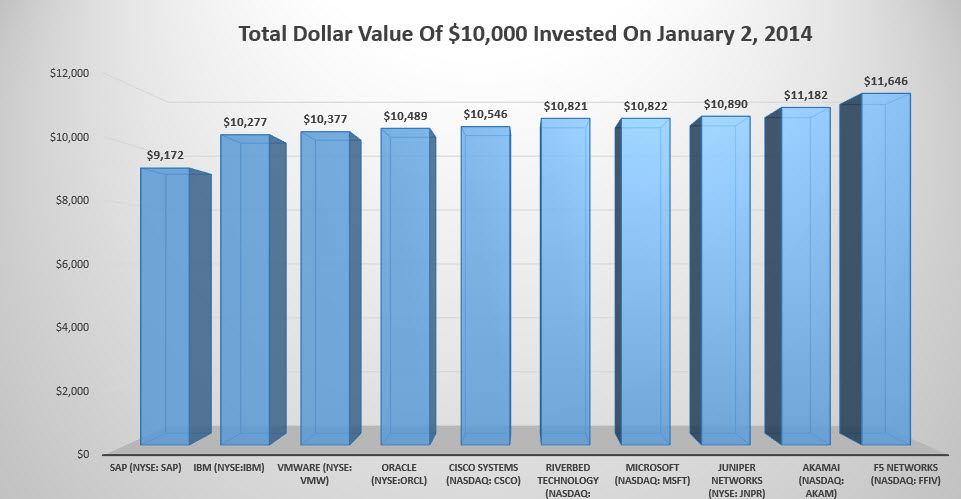
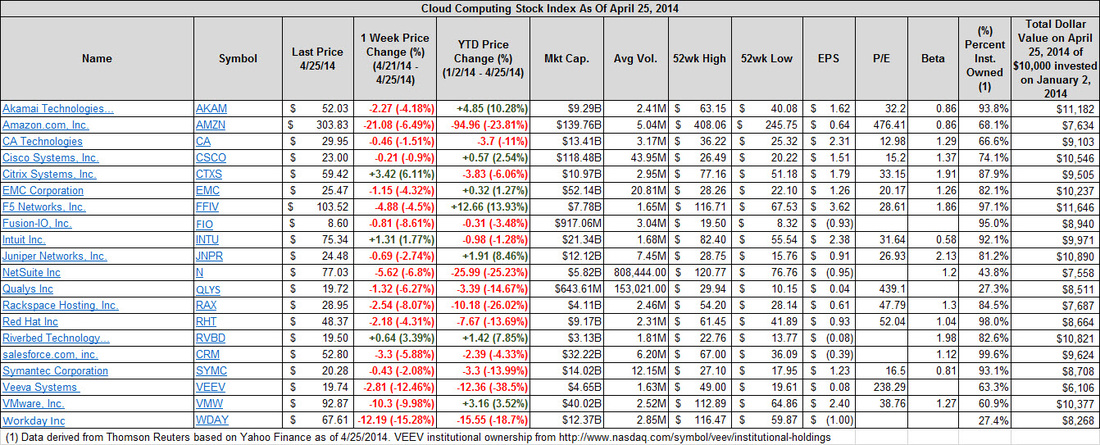
Please see the full Cloud Computing Index for market caps, average volumes, 52-week high and low share prices, Earnings per Share, Price/Earnings Ratio, and Beta. I am using the Google Finance Portfolio option to track the performance of these stocks. For information on how this index was created, see the description at the end of this post. I do not hold equity positions or work for any of the companies mentioned in this blog post or included in the and this post is not meant to provide investment advice. It is simply a glimpse into the performance of these company’s stock prices over time. Please click on the graphic to expand for easier reading.
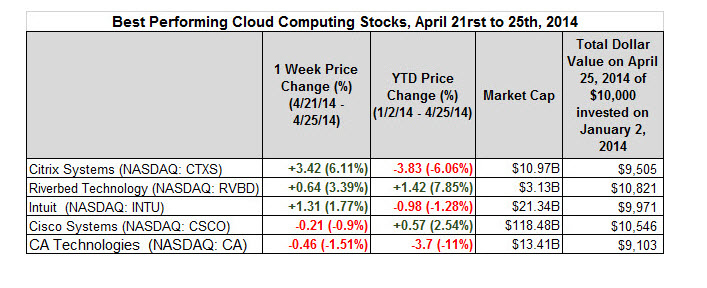
Best Performing Cloud Computing Stocks, April 21rst to 25th, 2014
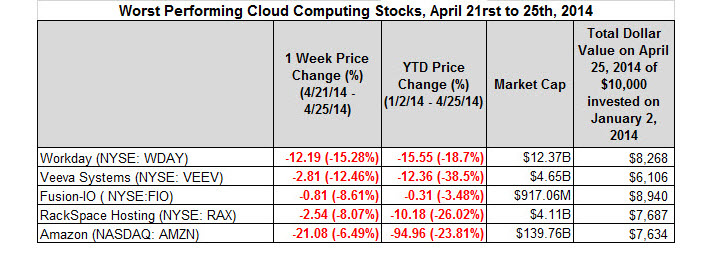
Worst Performing Cloud Computing Stocks, April 21rst to 25th, 2014
Best Performing Cloud Computing Stocks In 2014

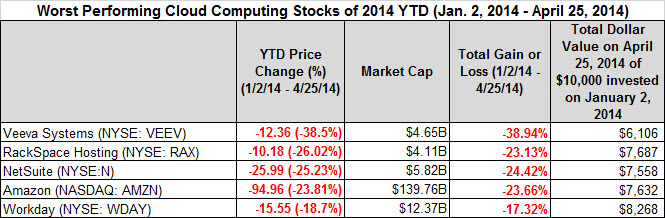
Worst Performing Cloud Computing Stocks In 2014
Comparing Cumulative Stock Performance
Performance of the Cloud Computing Index over the last year is compared to NetSuite, Salesforce, IBM, Oracle and SAP is below. This index has been up 15.99% over the last year, with NetSuite (NYSE:N) down 10.16%, Salesforce (NYSE:CRM) up 29.69%, IBM (NYSE:IBM) up 2.41%, Oracle (NYSE:ORCL) up 21.91% and SAP (NYSE:SAP) up .13%. Please click on the graphic to expand for easier reading. 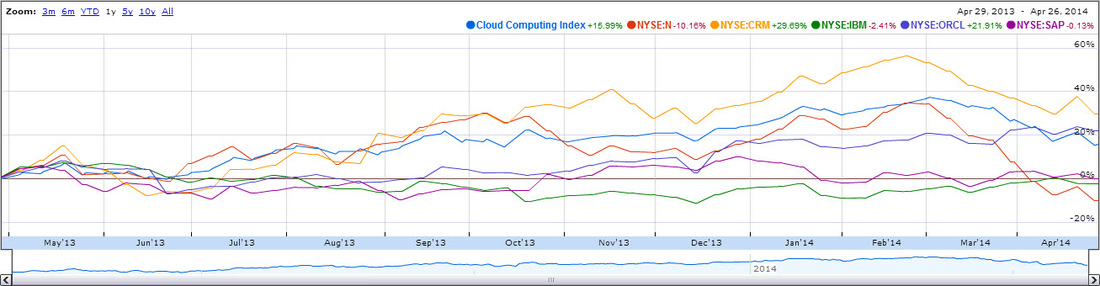
Specifics on the Cloud Computing Stock Index
I used The Cloud Times 100 as the basis of the index, selecting twenty companies all of which are publically traded. The latest edition of the Cloud Computing Index is shown here. The filter applied to these companies is that 50% or more of their revenues are generated from cloud-based applications, infrastructure and services Source http://www.forbes.com/sites/louiscolumbus/2014/04/27/best-and-worst-performing-cloud-computing-stocks-april-21rst-to-april-25th-and-year-to-date/
1 Comment
Leave a Reply. |
- Home
-
Applied Analytics
-
Analytics for Decision Making
>
- What is Cluster Analysis
- Data Reduction and Unsupervised Learning
- Preparing Data and Measuring Dissimilarities
- Hierarchical and k-Means Clustering
- Defining Output Variables and Analyzing the Results
- Using Historical Data to Model Uncertainty
- Models with Correlated Uncertain Variables
- Creating and Interpreting Charts
- Using Average Values versus Simulation
- Optimization and Decision Making
- Formulating an Optimization Problem
- Developing a Spreadsheet Model
- Adding Optimization to a Spreadsheet Model
- What-if Analysis and the Sensitivity Report
- Evaluating Scenarios and Visualizing Results to Gain Practical Insights
- Digital Marketing Application of Optimization
- Advanced Models for Better Decisions
- Business Problems with Yes/No Decisions
- Formulation and Solution of Binary Optimization Problems
- Metaheuristic Optimization
- Chance Constraints and Value At Risk
- Simulation Optimization
-
Analytics for Marketing
>
- Marketing Analytics and Customer Satisfaction
- Customer Satisfaction
- Measurements and Scaling Techniques – Introduction
- Primary Scales of Measurement
- Comparative Scaling
- Non-Comparative Scaling
- Experiment Design: Controlling for Experimental Errors
- A/B Testing: Introduction
- A/B Testing: Types of Tests
- ANOVA – Introduction
- Example -Inspect Spray and Tooth Growth
- Logit Model - Binary Outome and Forecastign linear regression
- Text Summarization
- Social media Microscope
- N-Gram - Frequcy Count and phase mining
- LDA Topic Modeling
- Machine-Learned Classification and Semantic Topic Tagging
- Data Engine >
-
Customer Insights
>
- Introduction
- What is Descriptive Analytics?
- Survey Overview
- Net Promoter Score and Self-Reports
- Survey Design
- Passive Data Collection
- Media Planning
- Data Visualization
- Causal Data Collection and Summary
- Asking Predictive Questions
- Regression Analysis
- Data Set Predictions
- Probability Models
- Results and Predictions
- Perspective Analytics (Maximize Revenue and Market Structure Competitions)
-
Analytics for Advance Marketing
>
- Visualisation and statistics (Political Advertising,Movie Theater and Data Assembly)
- Excel Analysis of Motion Picture Industry Data
- Displaying Conditional Distributions
- Analyzing Qualitative Variables
- Steps in Constructing Histograms
- Common Descriptive Statistics for Quantitative Data
- Regression-Based Modeling
- Customer Analytics
- Illustrating Customer Analytics in Excel
- Customer Valuation Excel Demonstration
-
Analytics for Decision Making
>
- Soft Skills
- Marketing
- Finance
-
Economics
- JBDON Golf
- Let's Talk
- MBA Project Sharing
-
About Us
-
Good Read
>
- IIMC says PepsiCo CEO Indra Nooyi was an average student
- India’s middle class figures in Fortune’s Top Ten list of those who matter
- The Start-Up of you.
- BUYING AND MERCHANDISING
- HUMAN RESOURCE MANAGEMENT
- Do You Suffer From Decision Fatigue?
- New Page
- About social media and web 2.0
- Building Your Own Start-up Technology Company, Part 1
- Building Your Own Start-up Technology Company, Part 2
- Building Your Own Start-up Technology Company, Part 3
- Building Your Own Start-up Technology Company, Part 4
- Renewable energy is no longer alternative energy
- What Makes an Exceptional Social Media Manager?
- The Forgotten Book that Helped Shape the Modern Economy
- Home
- How to Think Creatively
- A Lighthearted Looks at Project Management and Sports Analogies
- Why Trust Matters More Than Ever for Brands
-
Good Read
>
- CET Knowledge Zone
- Untitled
- New Page
- Adidas
